Medical Records for the 21st Century, take 2
The problem:
How to monitor the progression of the eye visual field test.
The test are usually collected by different doctors, different conditions, different machines, etc.
The closest measure to a "normalized data" is the "pattern deviation" on the visual field test.
Because it is based on the 85 percentile correction, one would hope that it is as good of a comparison as possible.
Until docors, hospitals and machine manufacturers quit the BS and put the patient well being ahead of their financial gains,
this have to do.
The "Temp" Solution:
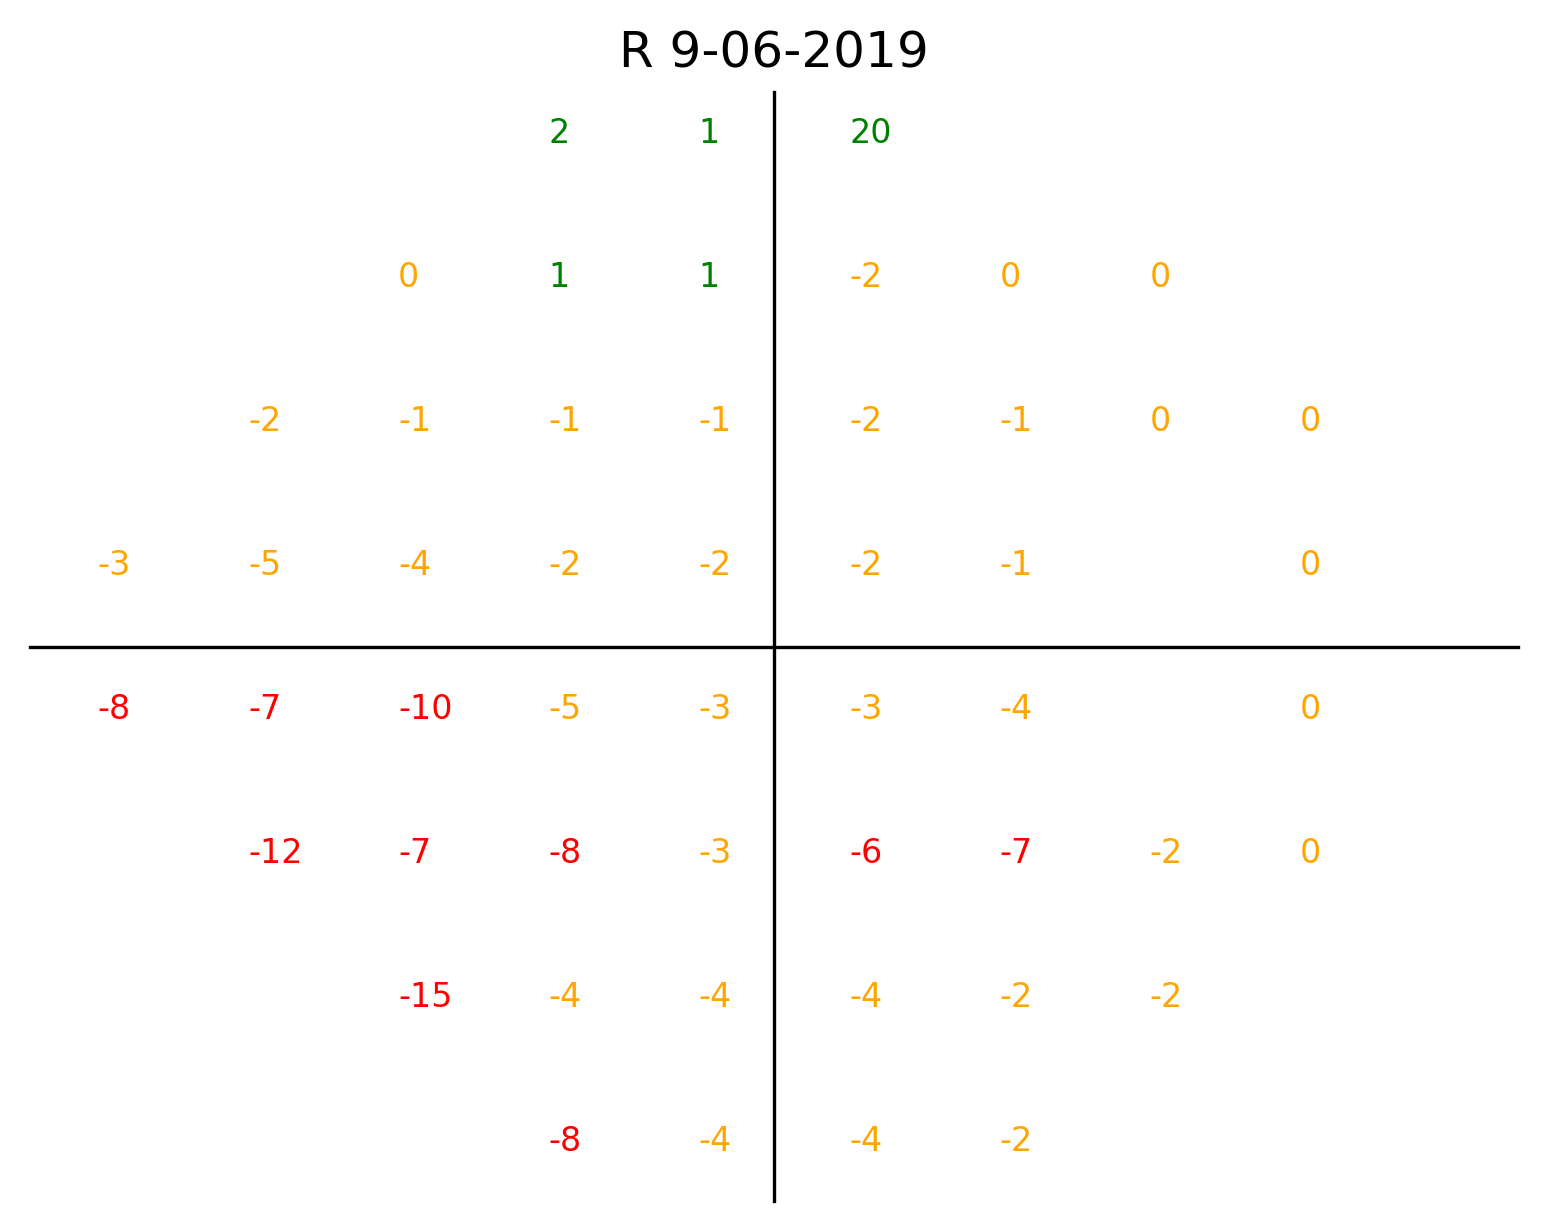
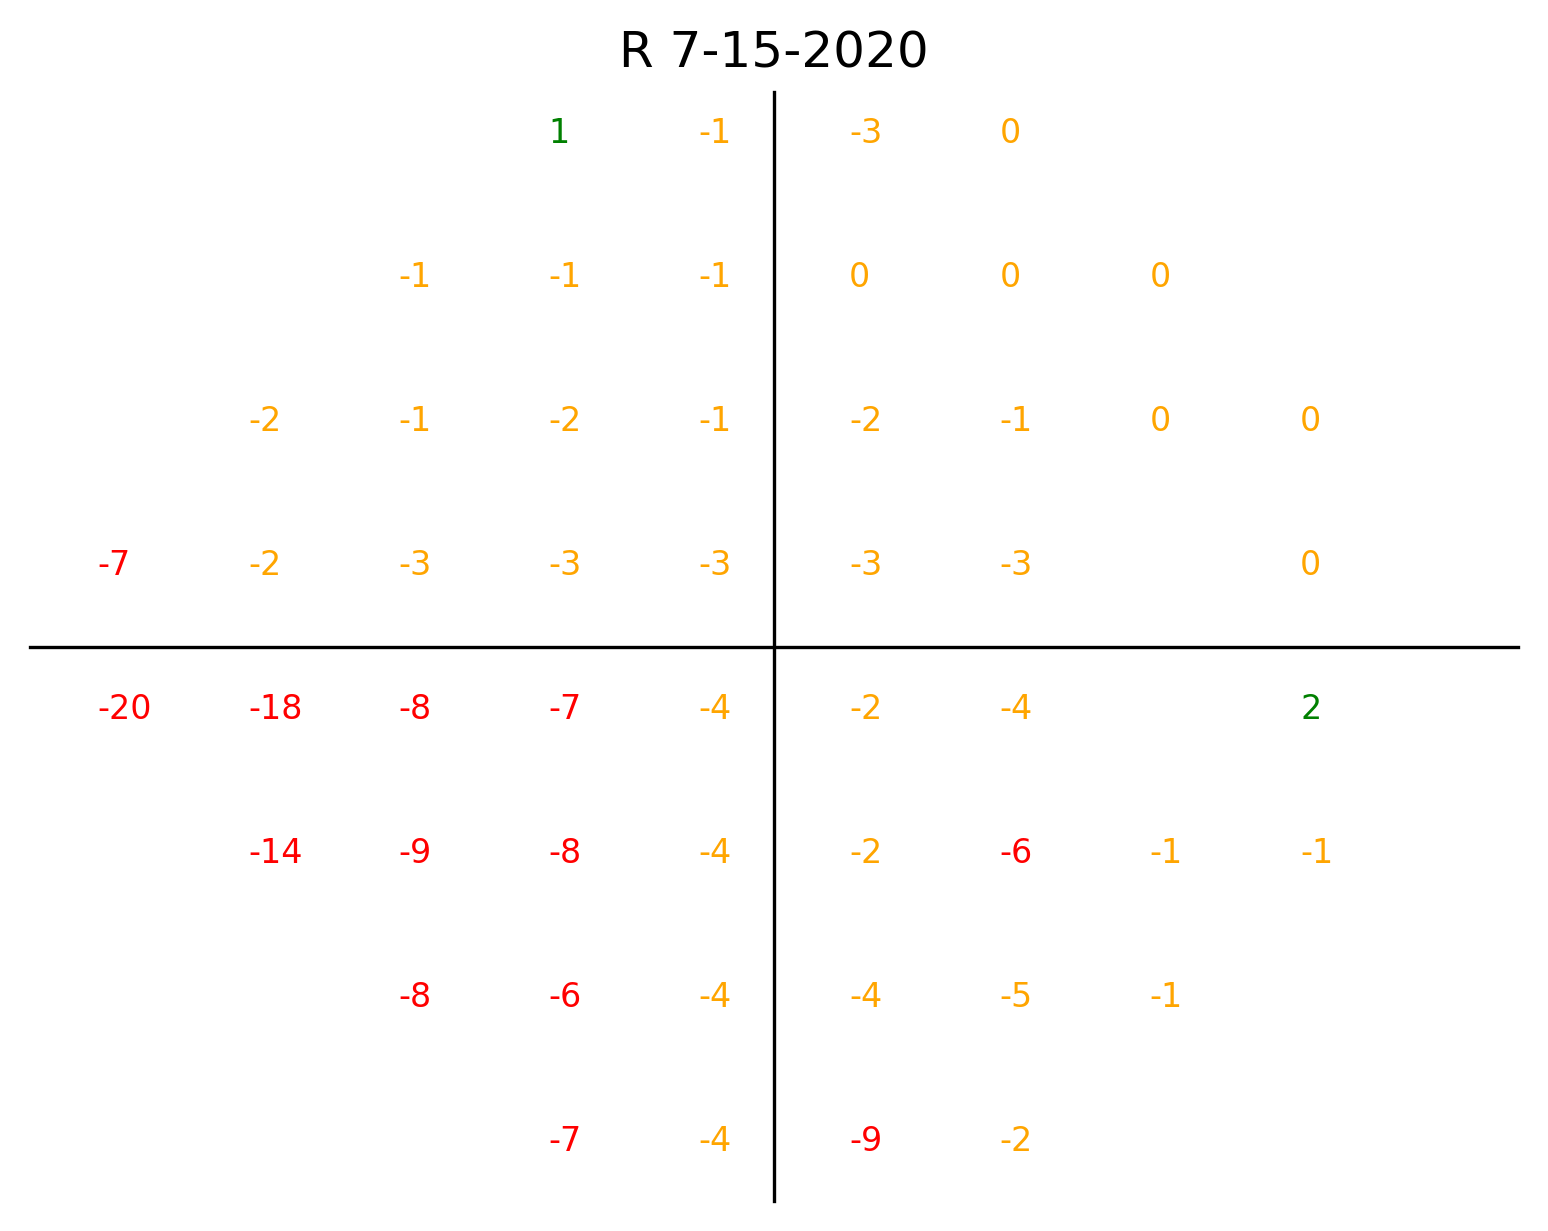
Below is a collection of data for a "right eye" visual field threshold test using SITA-Standard strategy.
It shows individual test resutls over few exams.
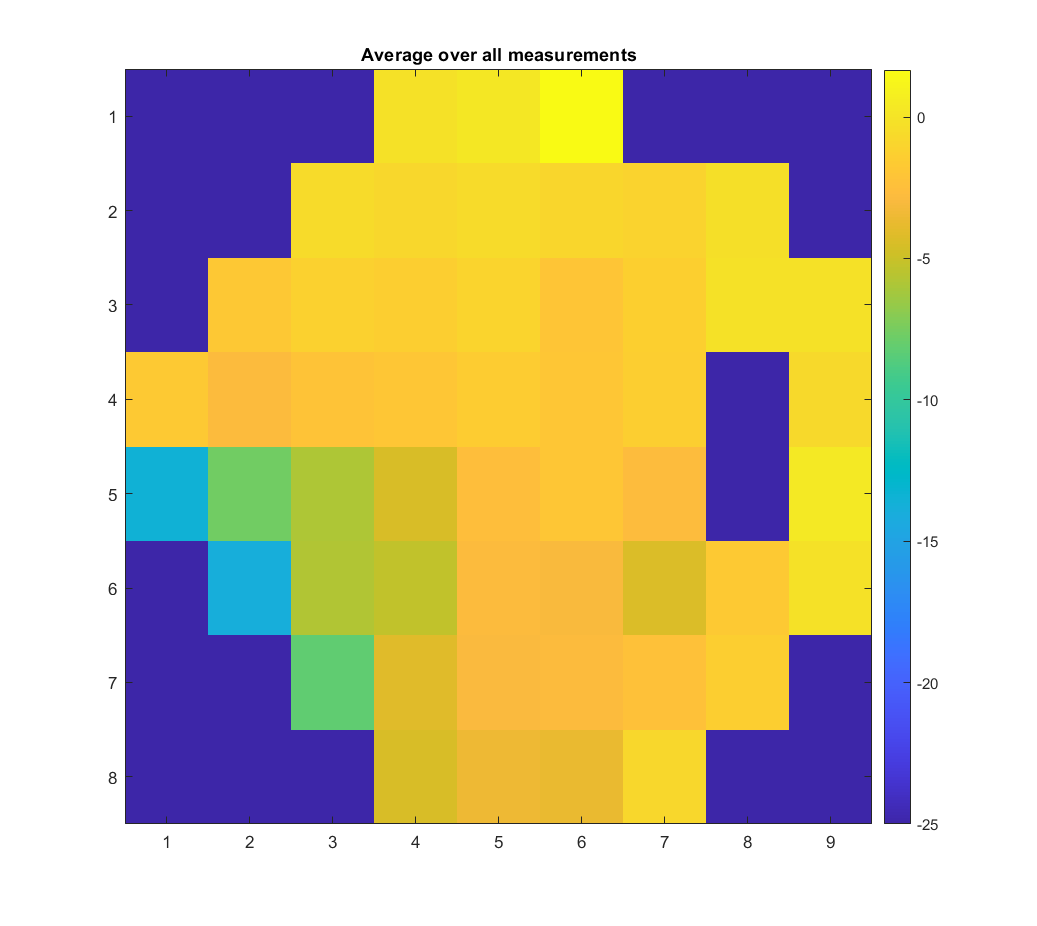
It also shows the average, which is a vital indicator to iron out any statistical variations.
A picture format for the averages was added.
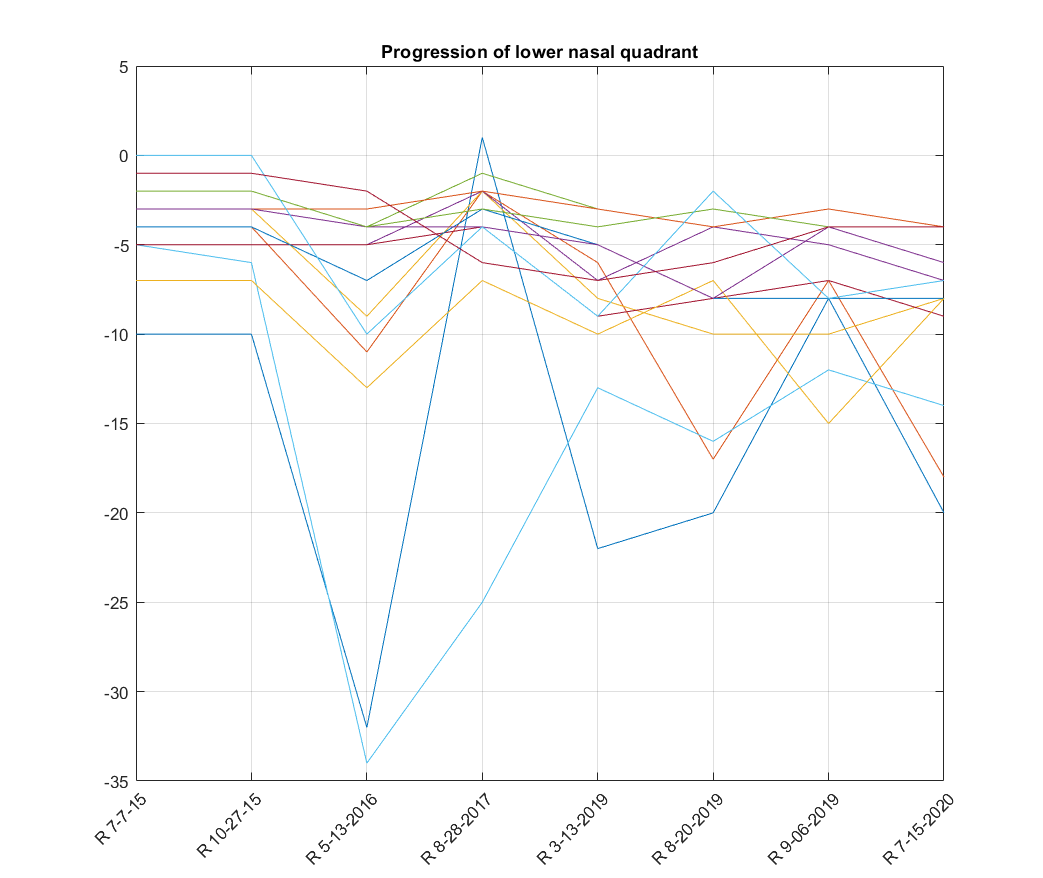
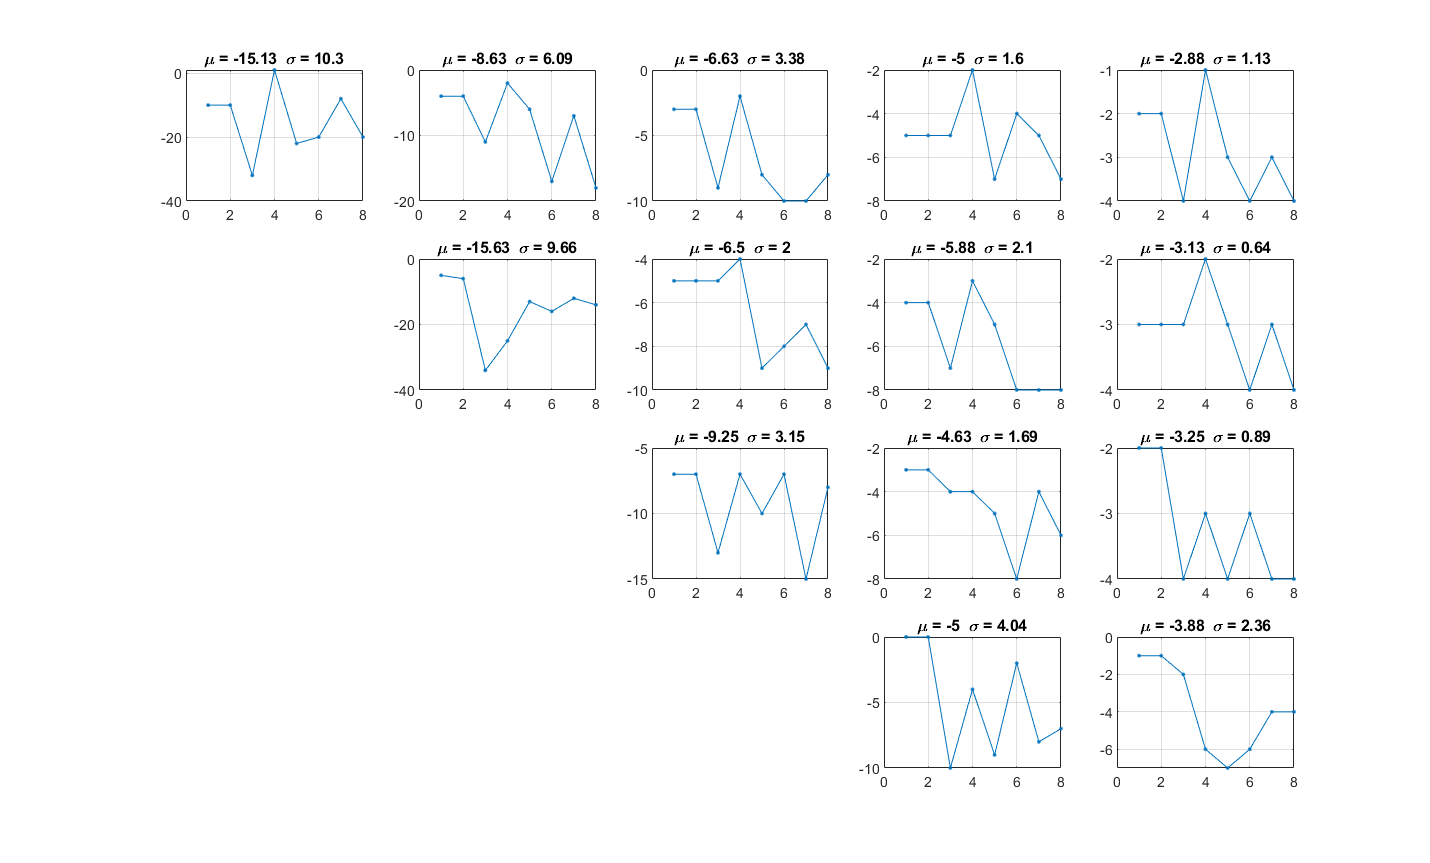
Finally we show the progression of the nasal lower quadrant of the eye to make sure that we see the change in each location as a function of time.
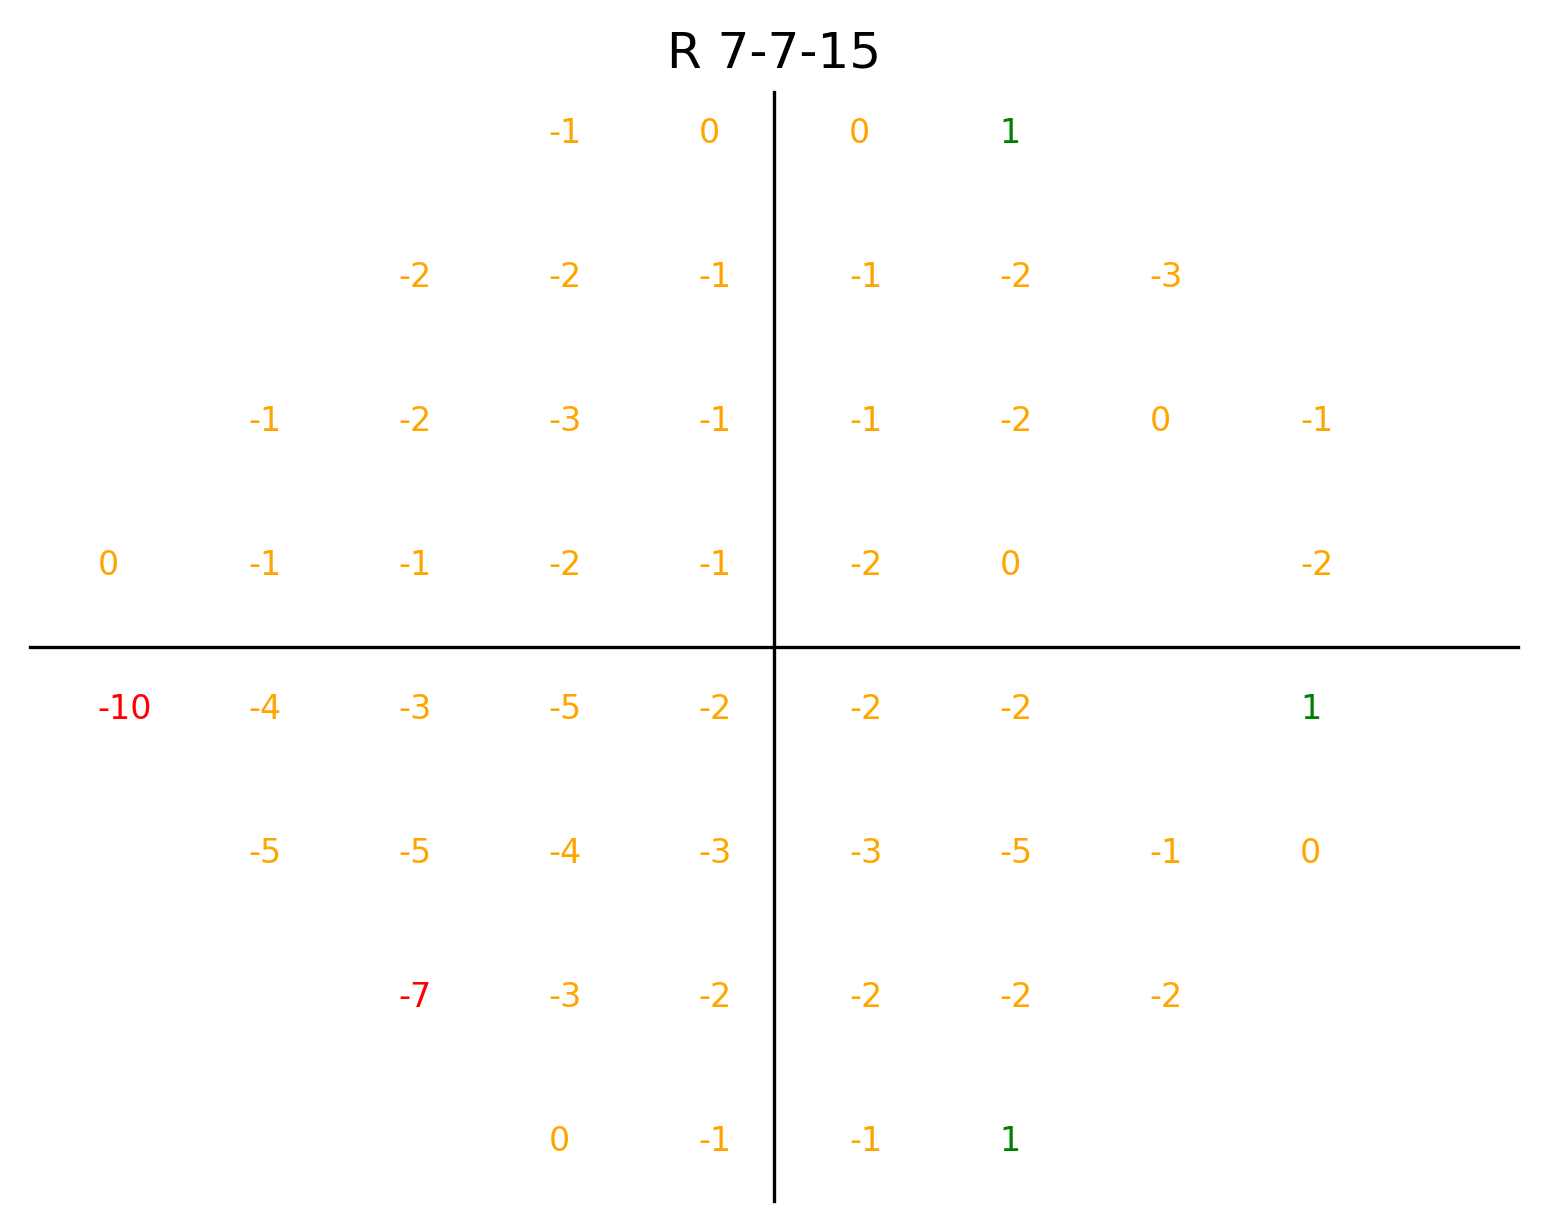
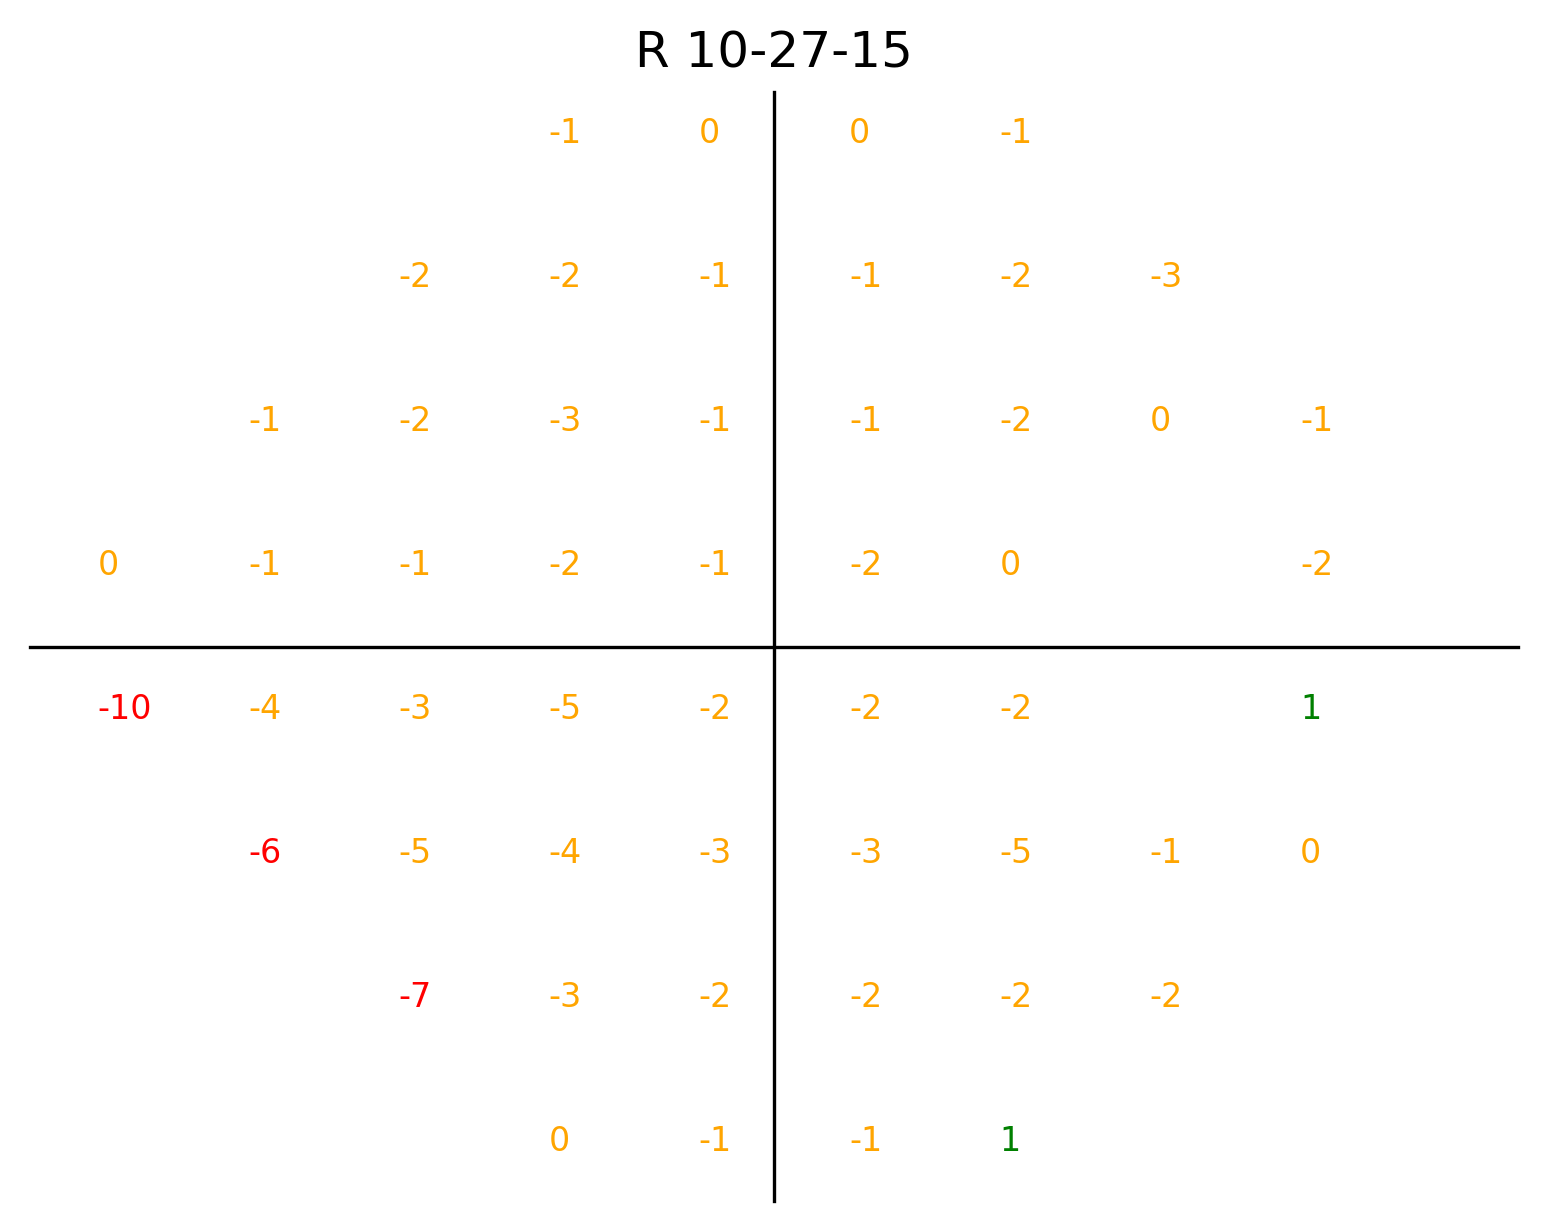
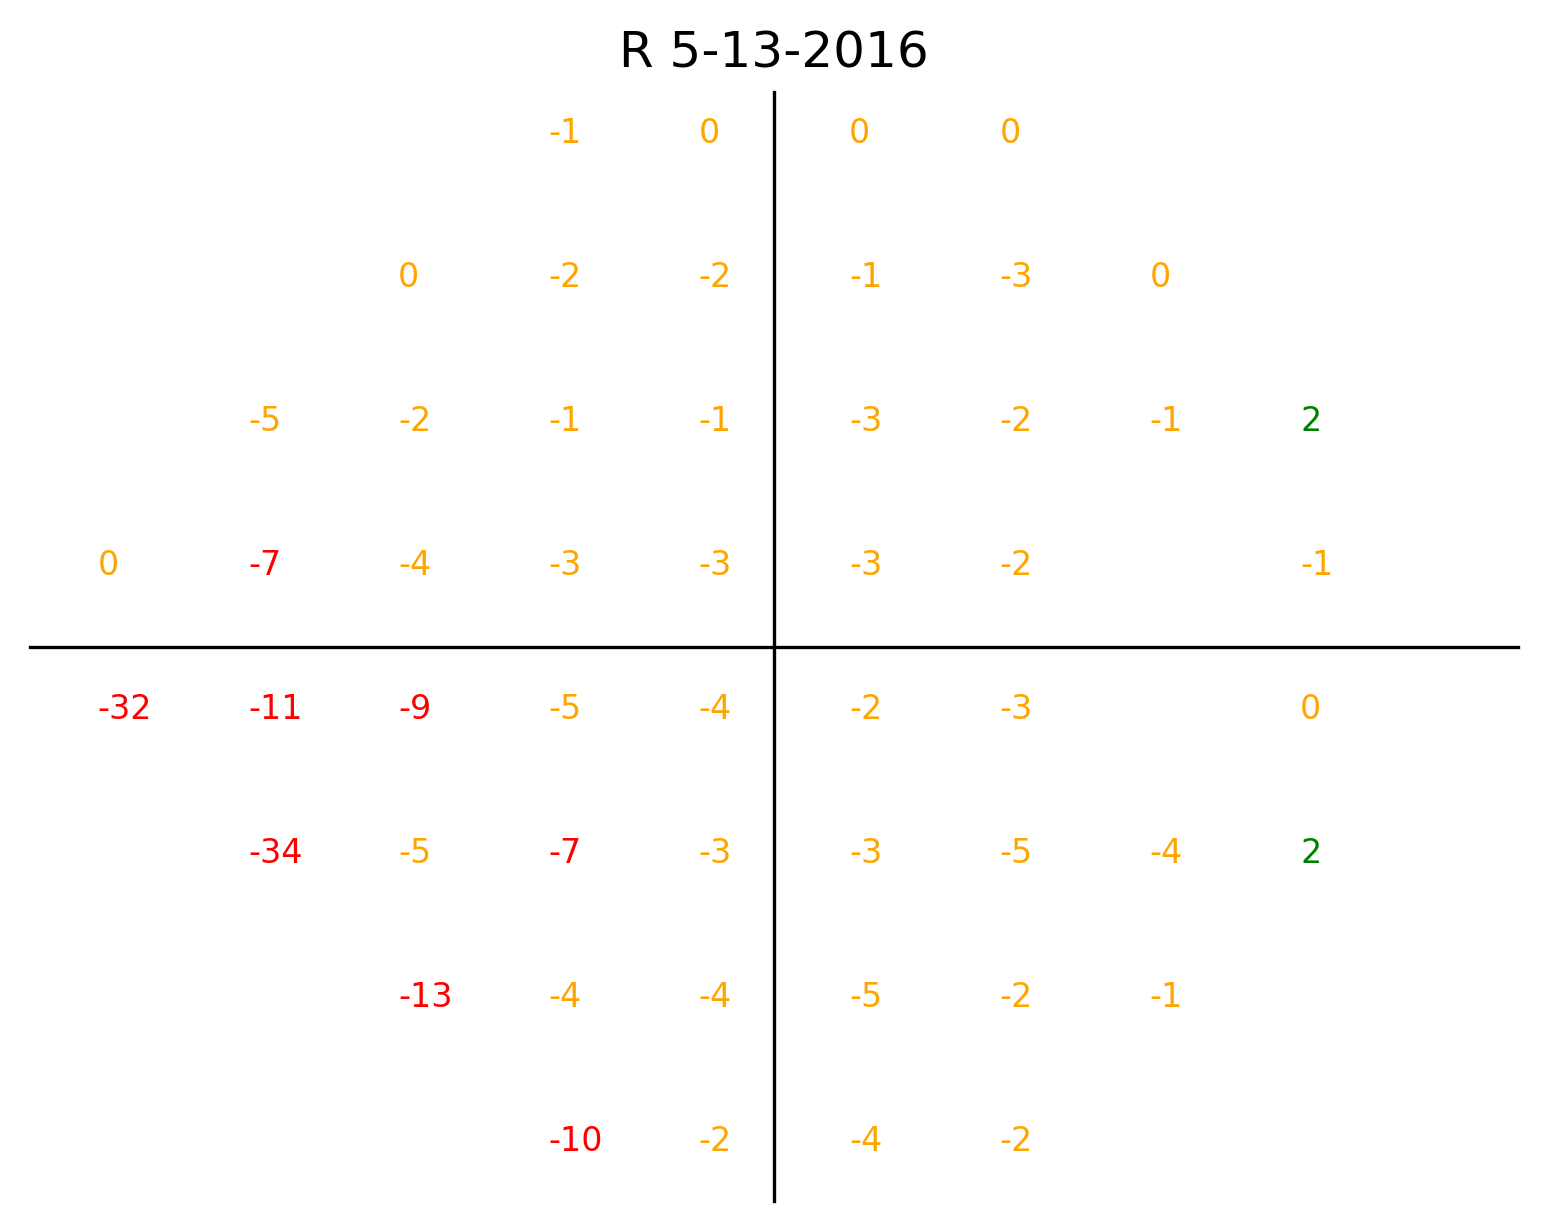
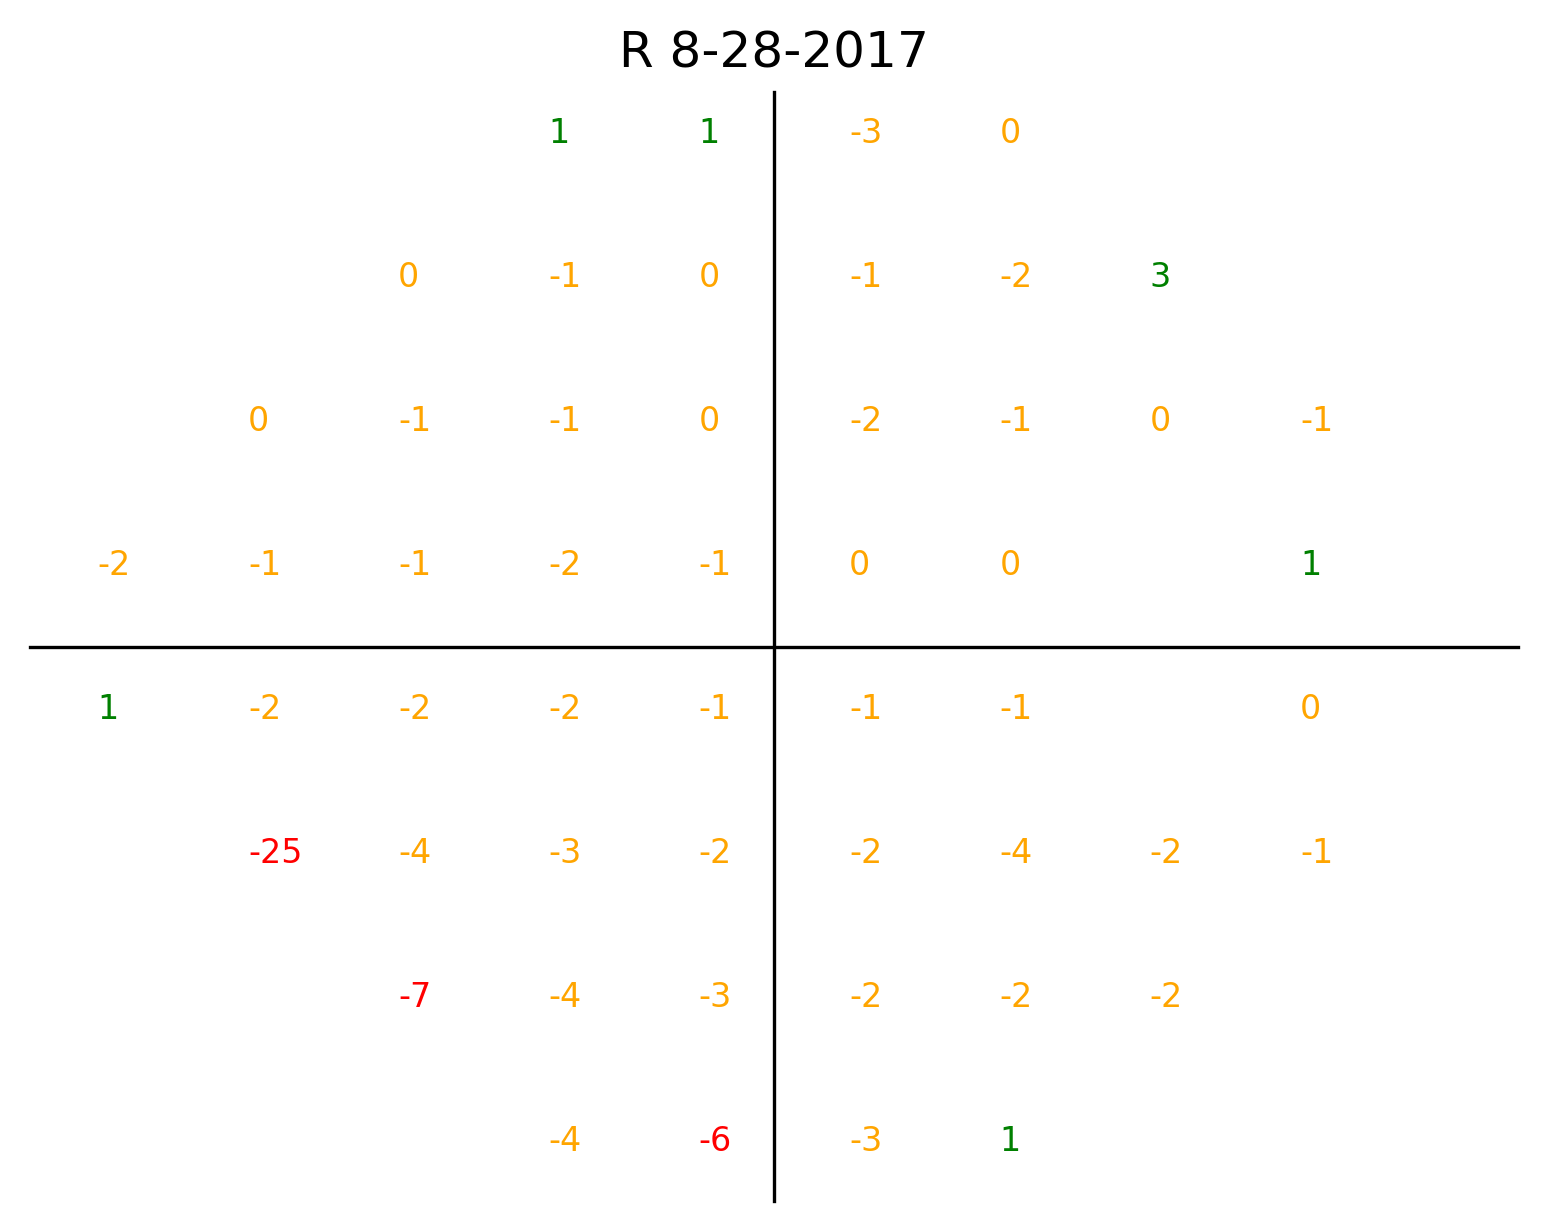

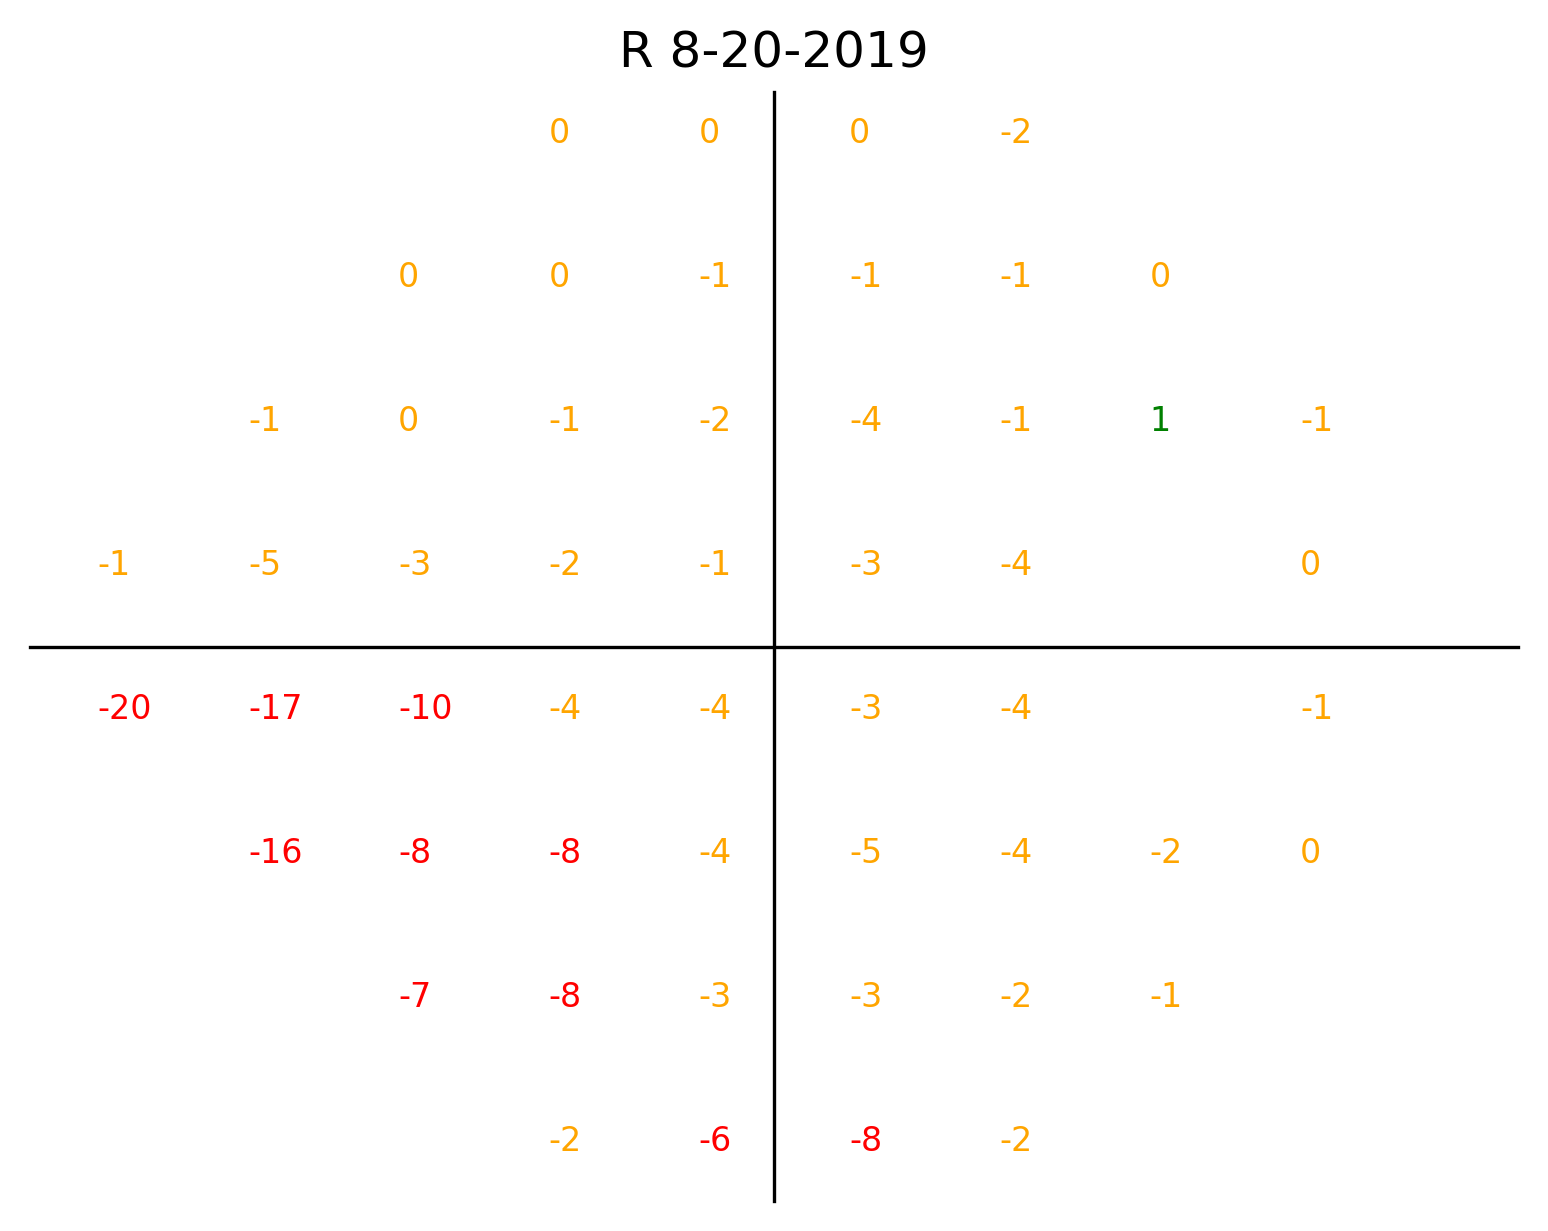
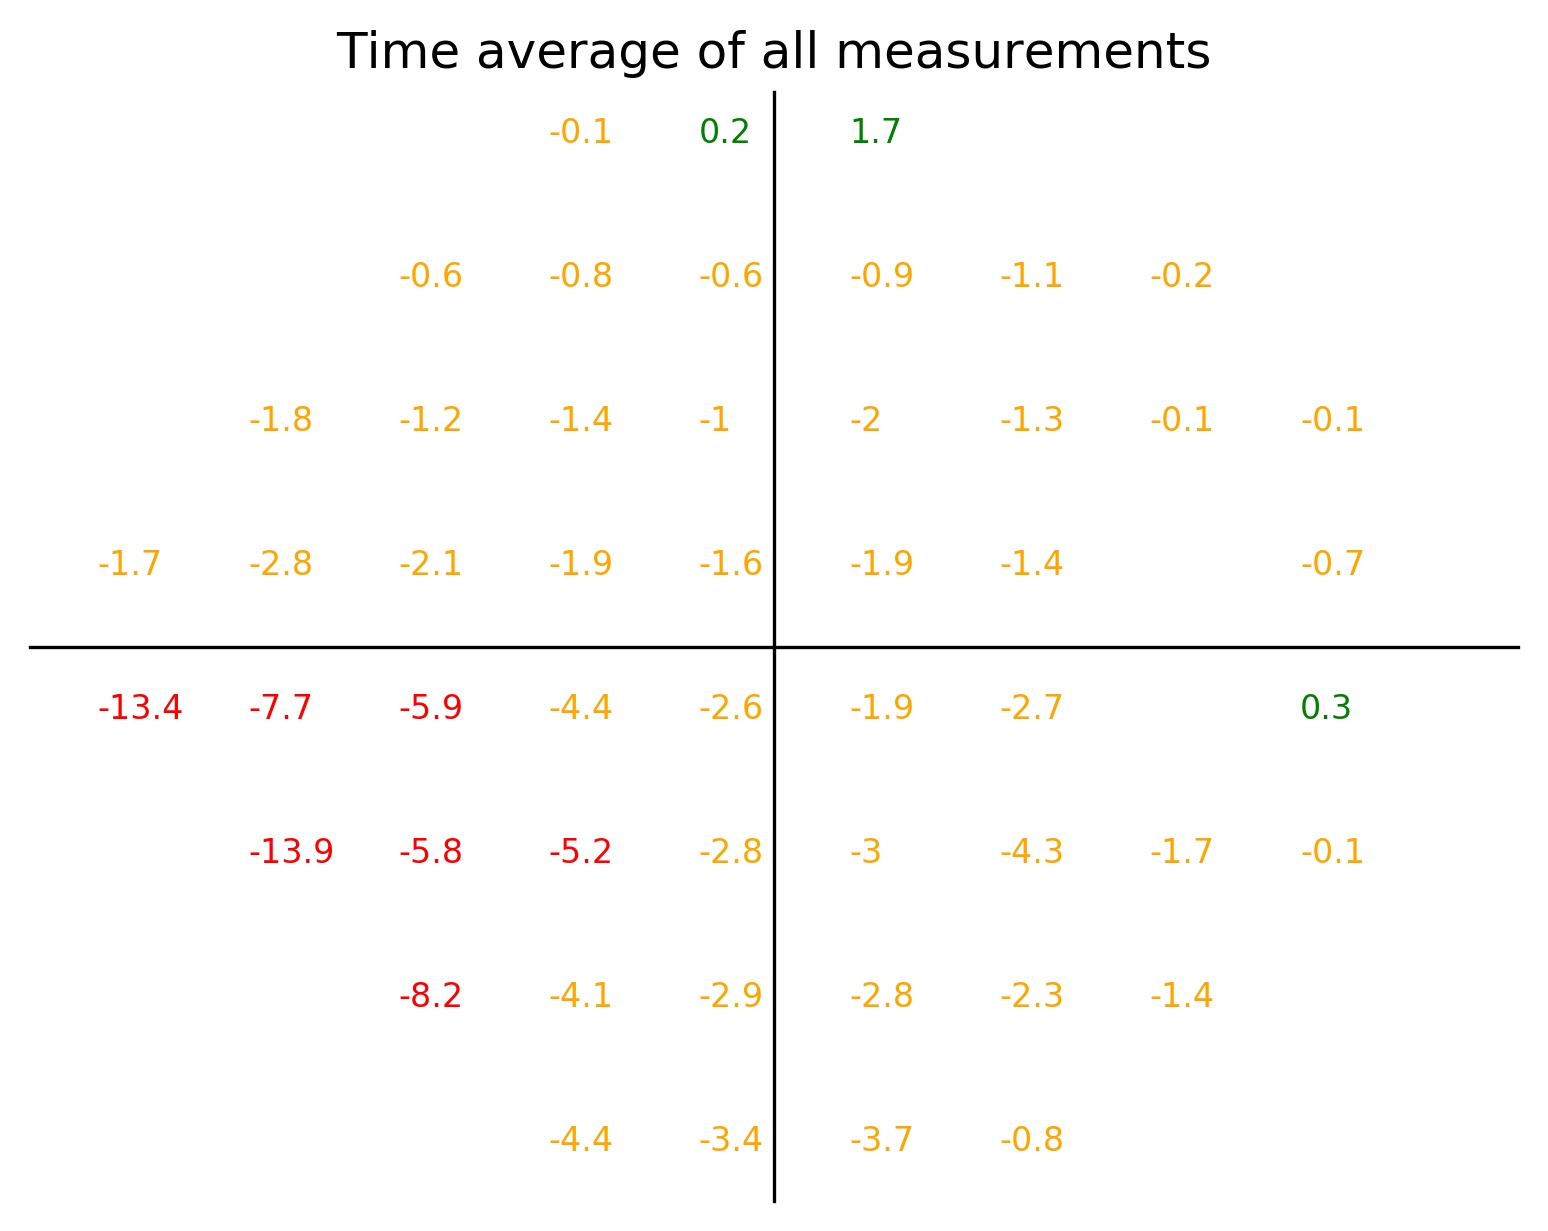
An image representation of the above figure.